The Alligator indicator is based on Bill Williams' TC Profitunity system. It is one of the most famous stock trading tools. It is used by many traders with varying degrees of success. There is still controversy surrounding this system. It brings good income to some traders, while others lose money using its capabilities. TC Profitunity is a multifaceted system consisting of several subsystems that constantly interact with each other.
An indicator based on this system provides the trader with the opportunity to simultaneously monitor several time periods. In the article below, it is discussed in relation to the binary options market.
Conditions for working with the Alligator indicator
You can work with Alligator on any terminal, setting the timeframe to H1 and higher. The trend indicator is used to monitor different currency pairs.
Trading using the indicator is carried out around the clock. Expiration is set on one candle.
Instructions for installing indicators in MetaTrader 4 :
System Features
Bill Williams, the developer of Alligator, and with him other exchange participants, stated that the current market situation reflects the sum of the opinions of all traders. This means that to obtain the information needed to make forecasts, it is enough to analyze prices.
To work with the Alligator indicator you need to understand the following points:
- How to determine the direction of the vector along which the market is moving?
- How to identify a turning point on a bar chart?
- How does the Alligator fan work?
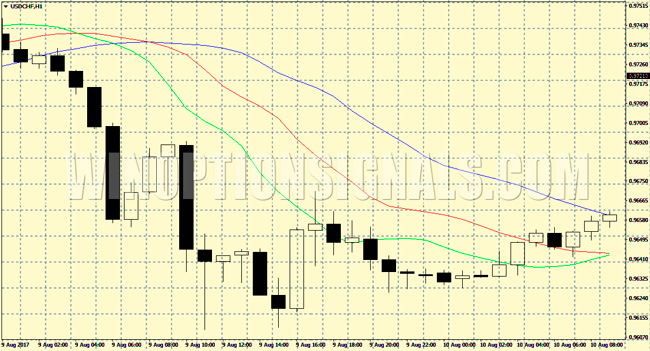
The indicator fan includes 3 MA (Moving Average). Their period is 5.8 and 13. The first smoothed moving average has a shift into the future by 3 bars, the second and third by 5 and 8 bars, respectively. This configuration forms the “mouth” of the Alligator.
This indicator provides a comprehensive assessment that includes several time intervals. It follows that the appearance of an open “mouth” indicates the presence of the same trend in several fractal levels.
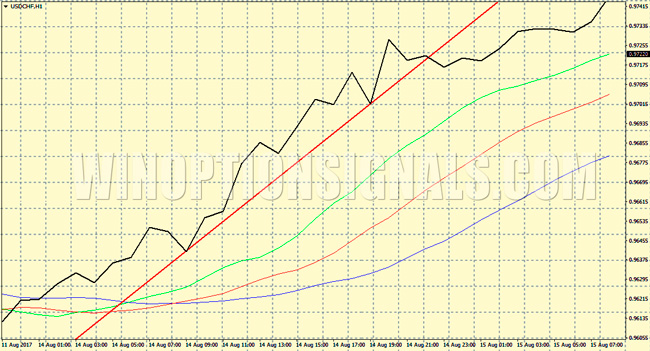
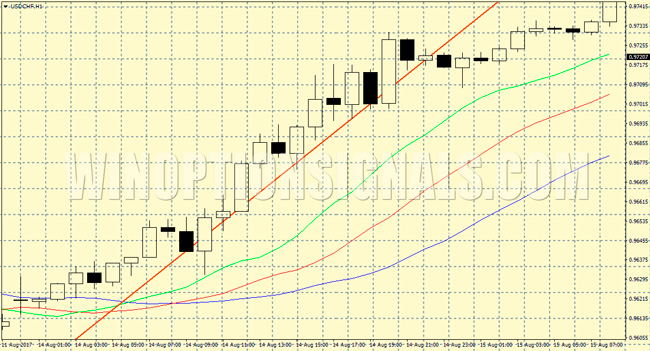
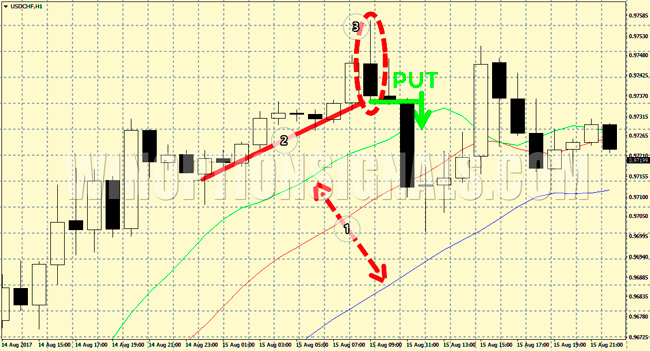
However, to make a profit on the stock exchange, it is necessary to determine not only the direction of the indicator, but also the trend on the current time frame. The latter is set based on candle closing prices. To do this, you need to open the “Line” chart and, setting the beginning of the line at the minimum indicator, draw it along the upward trend. The line thus obtained shows the slope of the trend.
It is necessary to perform the above actions on charts showing closing prices. Moreover, on a chart with bars, it is more difficult to determine the angle of inclination of a given line using the indicated manipulations due to the fact that it demonstrates many indicators.
The next and final stage of working with the indicator is determining the moment when market sentiment changes. It is detected at the highs of the current trend and indicates the direction of future movement. An upward trend is shown by a candle with a lower low relative to the previous figure with a closing price located above its half. The presence of this signal indicates a weakening position of sellers, which indicates an imminent change in the market trend.
A bearish reversal shows a reverse bar. It represents a candle whose high is located at a higher point relative to the previous figure, and the closing price is below its half. Such a bar appears before an uptrend turns into a downtrend.

Rules for working with the indicator
A Call option should be purchased under the following circumstances:
- the indicator lines are directed downwards;
- the current price is located below the indicator lines.
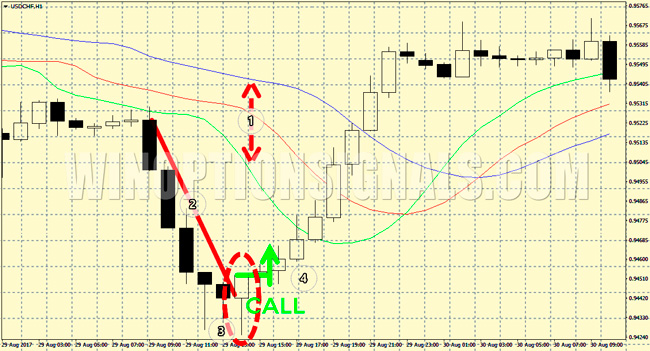
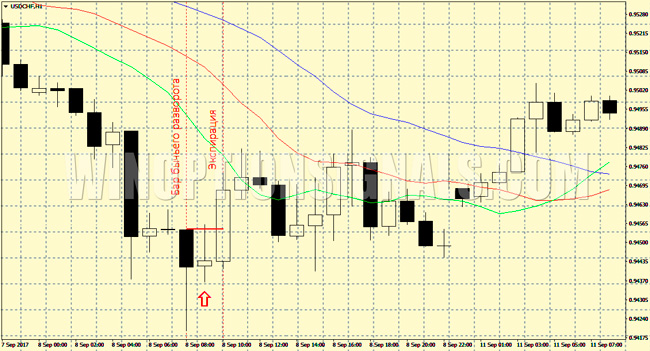
Once these indicators are reached, you should wait until the charts show the beginning of a trend reversal upward at a point located below the indicator lines. As soon as the price on the next bar exceeds the high of this reversal, you can open an option.
You can work with the Put option if the following conditions are met:
- indicator lines go up;
- the current price is located above the indicator lines.
When the specified indicators are achieved, you need to wait until a signal for a trend reversal to the downside appears on the chart. The bar indicating this should be located above the indicator lines. If the price on the next bar passes through the reversal low, you should open a Put option.
The strategies described are long-term in nature. They are not recommended for use in operations with a time frame of less than one hour. The expiration time is always set on one candle. This is due to the fact that Alligator trading is carried out against the current trend. And a reversal on the chart could be a correction.
Despite the fact that trading is carried out with a relatively large timeframe, the flow of signals will be quite stable. The best option is to choose a TF with H4 or D1.
Examples of trades with the Alligator indicator
As an example, we will consider the USD/CHF currency pair with an hourly timeframe. First, the direction of the current trend and indicator lines are determined. As soon as they go down, you should wait for a signal about a reversal of the bullish trend. After the price breaks the high of the bar (in the example under consideration this happened on the next candle), a Call option with an hourly expiration is opened. As a result, the deal will be closed
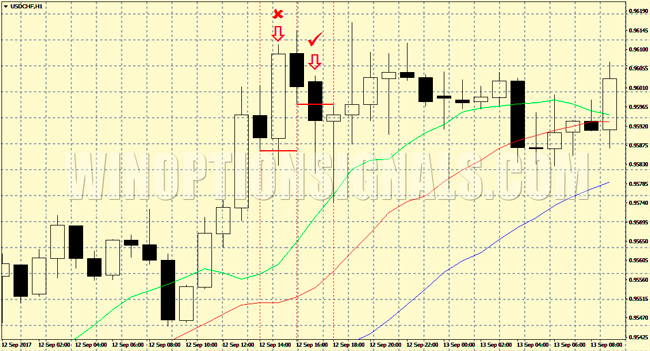
It is important to note that this system does not exclude the possibility of false signals for binary options trading . So, in the next chart, the price, which fell below the low of the bearish reversal, went up again. This indicates a trend correction. Within the framework of the market behavior strategy under consideration, 3 similar situations rarely arise in a row. If this happens, it is recommended to return to the initial transaction volume. This approach minimizes risks.
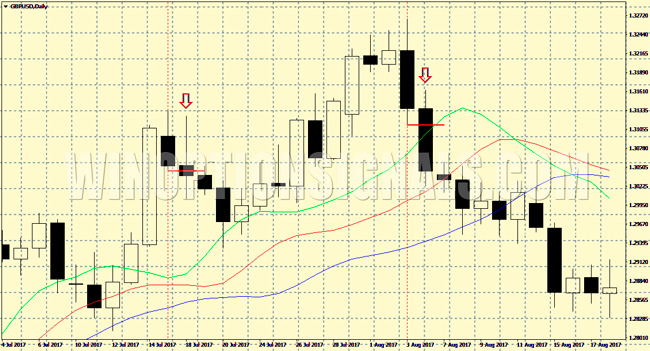
The Alligator indicator works well on the daily chart. This timeframe is recommended for beginners. It is considered the simplest and most convenient tool for working with binary options. Because of this, brokers often reduce the size of payments on long-term securities, since the daily chart is considered more predictable than the intraday chart.
conclusions
The Alligator indicator is an effective stock trading tool, the effectiveness of which has been proven many times. It demonstrates trends across several time periods, thanks to which the trader sees the overall situation on the market. By working with the Alligator indicator, you can promptly identify the moment of a change in sentiment or a change in trends.
Can't figure out how this strategy or indicator works? Write about it in the comments to this article, and also subscribe to our YouTube channel WinOptionSignals , where we will definitely answer all your questions in the video.
Download the Alligator indicator
See also:
News about binary options




To leave a comment, you must register or log in to your account.