Technical analysis is the basis with which trading is carried out on the Forex market. It allows you to predict price movements in advance. Before the advent of computers, traders manually drew patterns on charts, which allowed them to determine the future direction of the trend for a selected asset.
Later, when they began to trade on the Forex market using special programs, the search for models through which price movements are established became easier. However, this work also took a lot of time. It is especially difficult for traders who engage in intraday trading.
The Autochartist technical analysis indicator helps solve this problem. Moreover, this tool is distributed free of charge. Autochartist identifies chart patterns automatically and in real time. The indicator allows traders to fine-tune the optimal parameters for trading.
You can download Autochartist after opening a trading account. Access to the indicator is offered by most large companies ranked in Forex brokers.
What is Autochartist?
Autochartist is a technical tool that, in real time, identifies patterns on the price chart that indicate a continuation of the trend in the same direction or an imminent reversal of the latter. This development is released as a separate indicator used on the MT4 platform, or as a web application.
With Autochartist you can:
- identify patterns on the chart (channels, triangles, “Double Top”, etc.);
- identify strong support and resistance levels ;
- identify Fibonacci patterns;
- analyze the level of market volatility;
- view the history of strategy performance depending on the graphic models used;
- receive information about new signals by email.
The Autochartist indicator allows you to trade on the following timeframes:
- 15 minute;
- 30 minutes;
- H1;
- H4;
- D1.
Due to the fact that Autochartist is able to automatically perform volatility analysis, traders can adjust previously set take profit and stop loss levels depending on the readings of incoming signals. You need to understand that this indicator is not an advisor. Autochartist was developed as an auxiliary tool that makes it easier to find and build chart patterns. The success of a trader directly depends on his decisions and ability to take risks.

Advantages and Disadvantages of Autochartist
The advantages of the Autochartist indicator are as follows:
1. The tool is distributed free of charge and does not impose any special requirements on the quality and level of knowledge of the trader.
2. Search and construction of graphic figures are carried out automatically. Therefore, traders do not need to carry out such operations manually, which saves a lot of time. After constructing the figures, the indicator beeps or sends a corresponding message by email.
3. The indicator gives signals before the patterns on the chart are finally formed. This feature of Autochartist allows a trader to open or close positions before other market participants, which leads to increased profits.
4. Access to statistics allows you to evaluate the success of using specific signals and select the most optimal strategy .
5. The presence of filters makes it possible to fine-tune the indicator, due to which a trader can experiment with instruments and determine the most suitable patterns for trading.
6. There are a lot of educational materials on Autochartist on the Internet, with the help of which you can understand the features of the indicator.
7. The indicator is universal. Autochartist is built into the MT4 trading terminal , and can also work as a separate wtb application. In addition, the indicator is compatible with mobile devices.
Disadvantages of Autochartist include the following:
1. The indicator is most effective for intraday trading, which is carried out using graphical analysis.
2. Free trading signals sometimes arrive with a time delay, and therefore traders cannot use them. More often, this happens during a period when important news comes out, causing prices to rise or fall sharply.
3. To use all the capabilities of the indicator, you need to spend time learning the intricacies of the instrument.
Another major disadvantage of Autochartist is that some brokers do not offer free signals to traders. Therefore, before installing the indicator, it is recommended to clarify this nuance with the support service of the financial company.

How to install Autochartist in MT4 ?
Many indicators are installed in the trading system through the “Data Catalog” item. To take advantage of the capabilities of this tool, you must perform other manipulations.
Installing Autochartist involves the following steps:
1. Download Autochartist from the broker's website. The extension of the installation file is .mg4 (for other indicators - .exe).
2. Run the installation file and select the language in which the indicator will work.
3. Confirm the user agreement.
4. Specify the path to the folder in which the trading platform files are stored.
5. Restart the trading terminal.
When specifying the path to the folder, you need to select the trading terminal of the broker from whose website you downloaded Autochartist.
How to use Autochartist?
Before you start working with Autochartist, you need to move the indicator from the Navigator window to the chart (the location does not matter). Immediately after this, a menu with settings opens. In the window that appears, select “Allow DLL use.” This requirement is explained by the fact that the information that Autochartist operates is collected on its website.
The installed program provides access to 6 indicators:
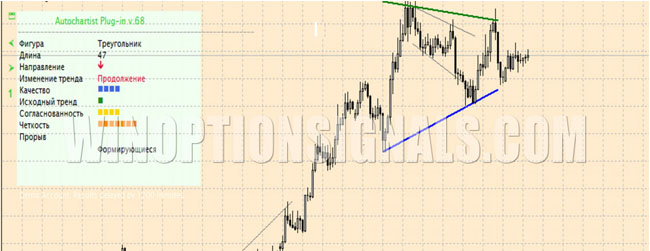
1. Chat Patterns. An indicator that identifies graphic patterns, displays them on the screen and analyzes the patterns.
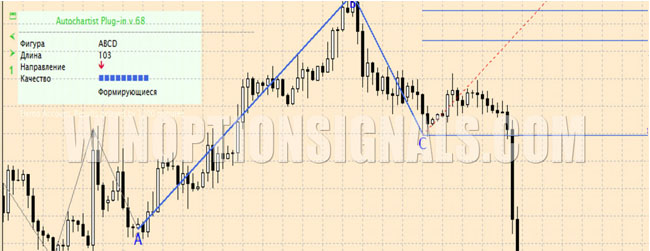
2. Fibonacci Patterns. The indicator detects Fibonacci patterns.
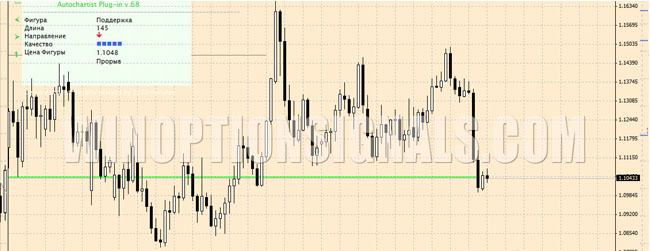
3. Key Levels. Draws support and resistance levels on the chart.
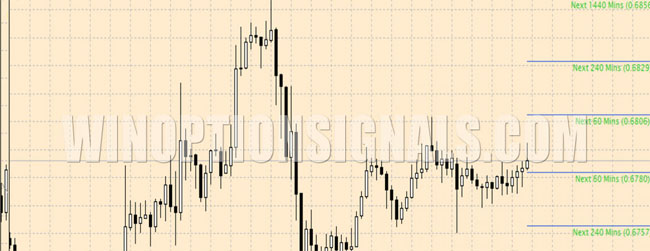
4. Volatility. The indicator makes a forecast of volatility levels within a certain timeframe.
5. Market Reports. The indicator must first be activated in the default browser. Market Reports, at the request of a trader, generates a report that provides an analysis of the current market situation for major assets (including prices for gold and oil).
The software package also includes a Web Application, with which you can launch Autochartist through a browser.
How to set up the Autochartist indicator?
The indicators included in the Autochartist package are configured according to a similar principle. Therefore, below are the parameters that correspond to all the previously described tools:
- Timezoneoffset. Automatically synchronizes the time zones in which the Autochartist server and broker operate. After installing the indicator, no additional settings are required. Autochartist will automatically synchronize the time.
- Pattern_Count. Option to configure the number of patterns displayed on the chart.
- Filter_ShowEmerging. If you select this option, the indicator will display emerging graphic patterns on the screen.
- Filter_ShowCompleted. If you set the parameter to “true”, the indicator will display completed patterns on the chart.
- Filter_ShowLegend. After enabling this option, an information panel will appear on the chart.
- Filter_ShowTargetRegian. This option allows access to the forecast area.
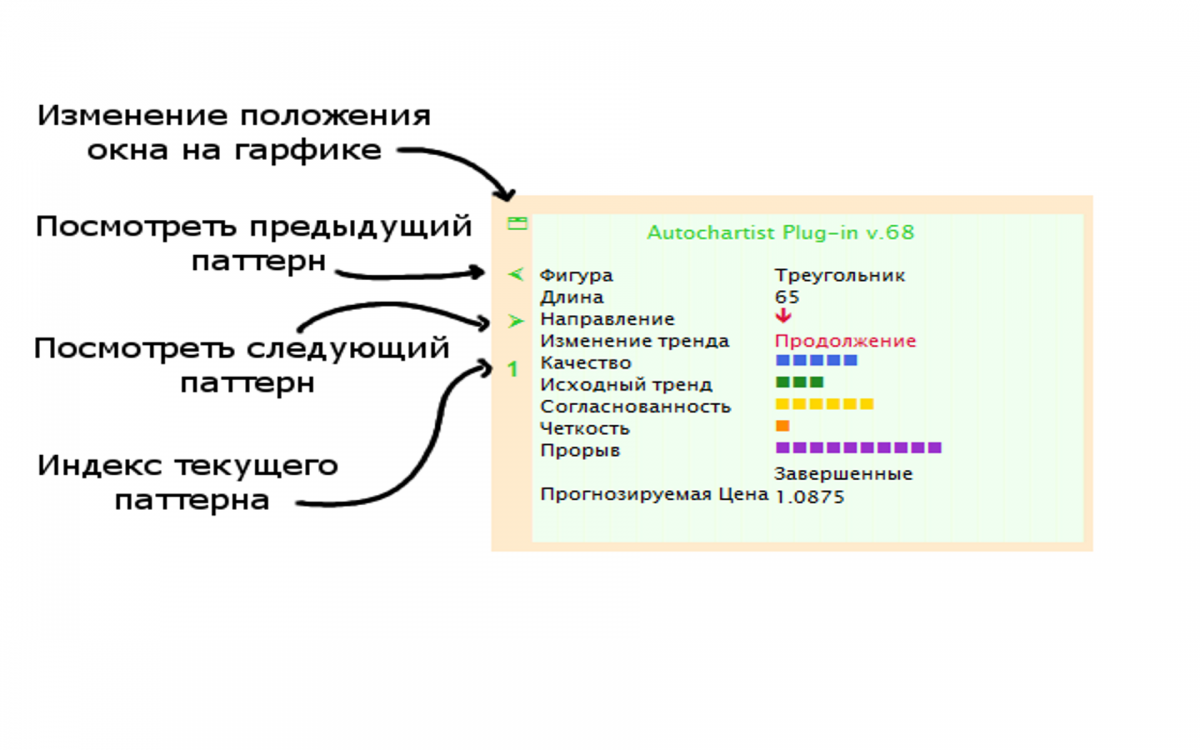
The information panel contains:
- pattern name;
- trend direction;
- price forecast.
If necessary, the trader can move the information panel window to any part of the chart and select other patterns.
In addition to the above settings, Autochartist includes additional filters that help remove “weak” patterns.
The program is highly variable. Autochartist allows you to trade during flat and pronounced trend periods using indicator signals.
Autochartist web application
An important feature of the program is that traders do not have to install Autochartist in the MT4 trading terminal. The developers have created a web application that provides access to similar tools.
To take advantage of the program's capabilities through a browser, just drag the Autochartist Web Application indicator onto the chart. After this, the web application opens.
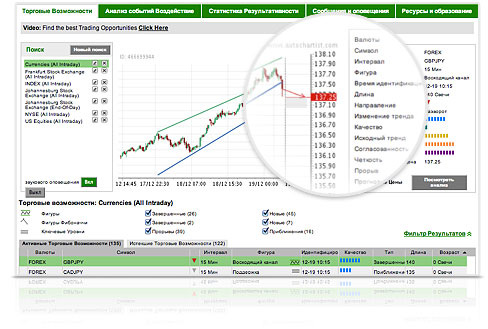
The window that appears contains 5 tabs:
- trading opportunities;
- volatility analysis;
- performance statistics;
- messages and alerts;
- trading community.
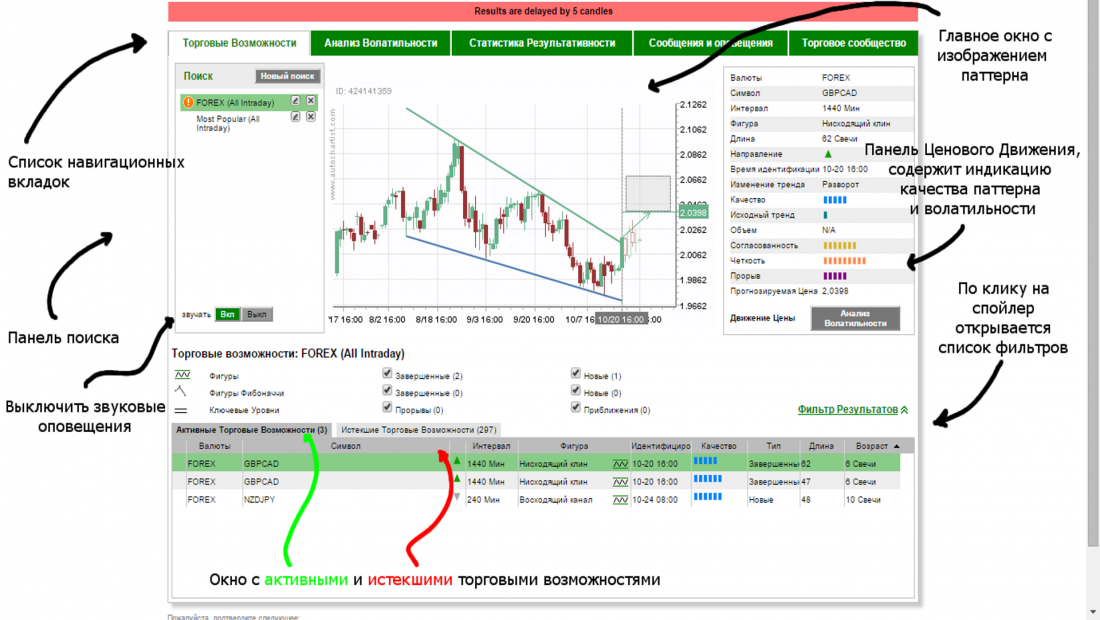
The first tab is a working window in which emerging or ready-made models are presented. The application allows you to increase the size of the graph (to do this you need to click once). On the right side of the window there is an information panel that shows the quality of the pattern and the accuracy of its formation. Below are filters that allow you to sort the shapes.
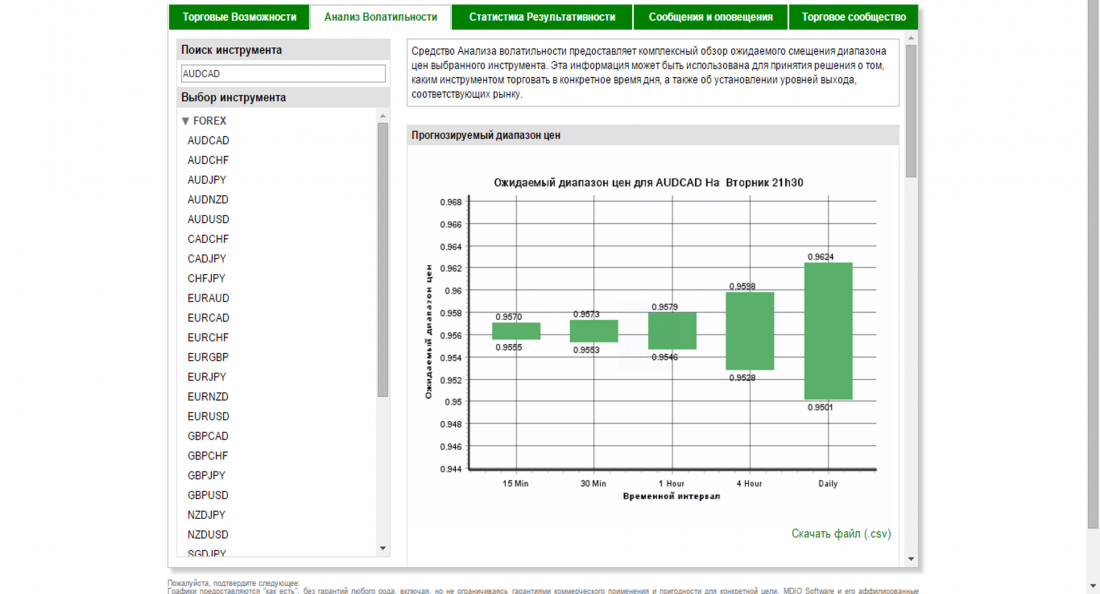
The second tab regularly updates information about the predicted price movement for a specific asset.
In the statistics window, a trader can analyze the effectiveness of the patterns and tools used.
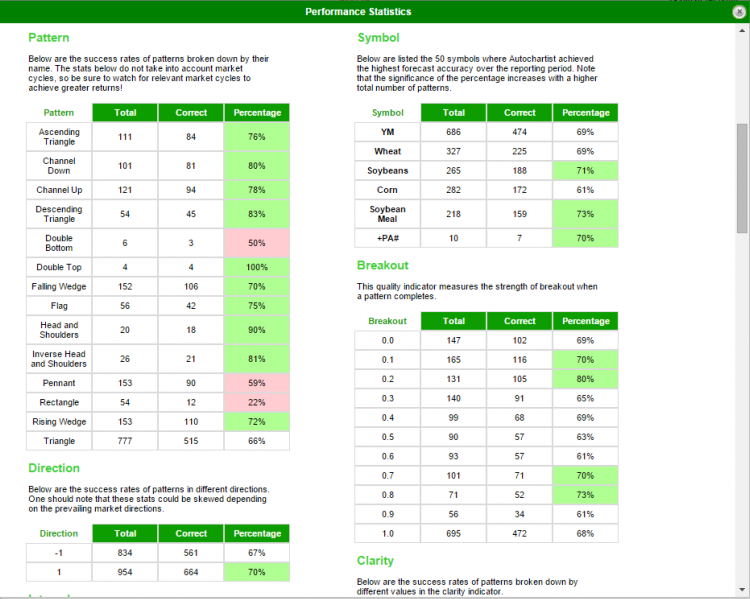
In the alerts tab, you can configure the settings for automatically sending messages containing trading signals, price forecasts and economic news. Information is sent by email.
The last tab provides access to tutorials, videos and other materials designed to familiarize you with the features of Autochartist.
This indicator, like other similar tools, does not solve all the trader’s problems. Autochartist is not capable of consistently providing exceptionally profitable trading signals. Indicators are a tool that simplifies technical analysis.
Thanks to the fact that Autochartist automatically identifies and builds graphic patterns, the trader can spend the freed-up time on solving other problems. As a result, the quality of work improves and the profitability of trading on the Forex market increases.
Autochartist is also useful for new traders. The program helps you quickly become familiar with the basics of technical analysis.
Autochartist is distinguished by its intuitive interface and accurate forecasts that the indicator provides. These features have made the program one of the most popular among traders. Even though Autochartist is free, not all brokers allow you to use it. You can use Autochartist for free by opening an account with one of the reliable Forex brokers .


To leave a comment, you must register or log in to your account.