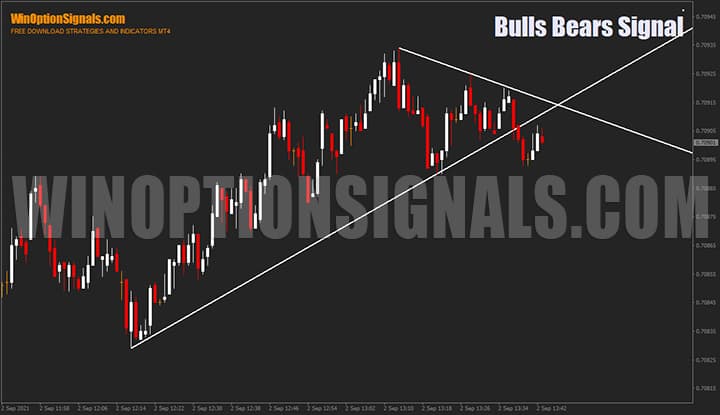
The indicator for binary options Bulls Bears Signal automatically builds sloping trend lines on the chart. The main difference between the trend lines of the indicator is the uniqueness of their construction: while standard slanted lines are drawn along the nearest minimums or maximums, the slanted lines of the Bulls Bears Signal indicator draw several lines in the form of graphic analysis figures , the penetration of which is a signal to enter the market .
If the price breaks through the support or resistance levels constructed by the indicator, you will see a corresponding notification (alert) in the terminal, which greatly simplifies optimized work with a powerful technical analysis tool - trend sloping lines.
Characteristics of the indicator for binary options Bulls Bears Signal
- Terminal: MetaTrader 4 .
- Timeframe: any.
- Expiration: 1 or 5 candles.
- Types of options: Call/Put.
- Indicators: Bulls Bears Signal.ex4.
- Trading instruments: currency pairs , stocks, cryptocurrencies , commodities.
- Trading time: 8:00-20:00 Moscow time.
- Recommended brokers: Quotex , PocketOption , Deriv , Binarium .
Installing the Bulls Bears Signal binary options indicator in MT4
The indicator is installed as standard in the MetaTrader 4 terminal.
MetaTrader 4 instructions for installing indicators:
Review and settings of the Bulls Bears Signal indicator for binary options
The indicator independently finds points for constructing inclined trend lines and plots them. This simplifies the trader’s work, since the sloping lines of the indicator will always be drawn on the chart on time, correctly and without errors. Optimizing technical analysis tools not only simplifies the process of market analysis, but also opens up new opportunities for the trader, for example, trading on smaller time frames , as well as simultaneous consideration of a large number of financial assets, and so on.
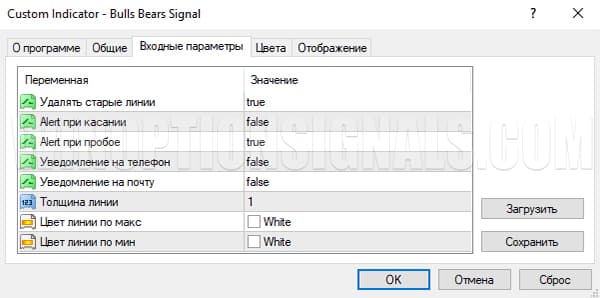
The indicator settings contain the following variables:
- Alert when touched – select “true” if you want to receive notifications from the indicator when the price touches the sloping line;
- Alert on breakout – select “true” if you want to receive a notification from the indicator if the price breaks through the sloping line;
- Notification by mail or phone – responsible for notifications to a mobile phone or email;
- Line thickness is a convenience parameter where you can change the thickness of the lines;
- Color along the high and low lines – adjusting the color of the upper and lower lines.
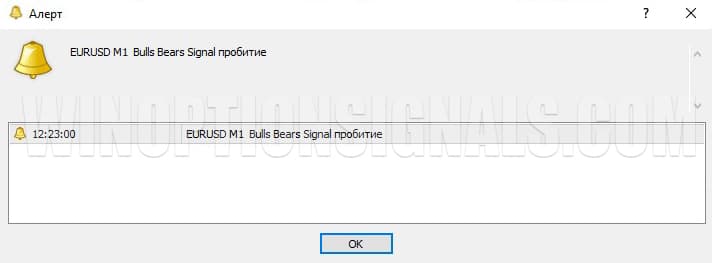
Notifications (alerts) when touching or breaking through look like this in the terminal:
Trading rules using the Bulls Bears Signal indicator for binary options
The principle of working with the indicator is similar to the classical rules of working with inclined lines:
- To determine the direction of the trend, the angle of the line is used.
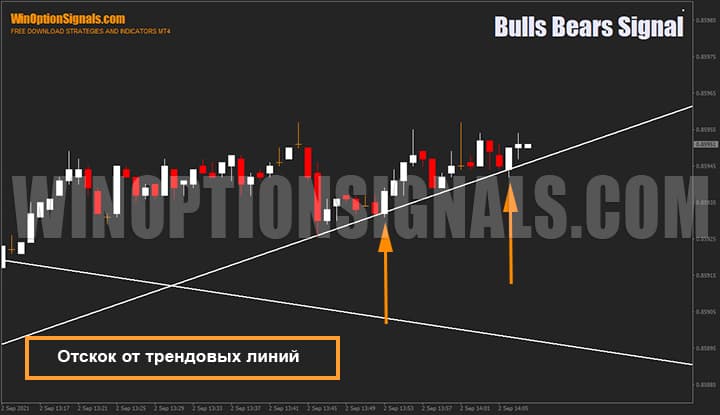
- The approach of the price to the inclined line often continues with a rebound and continuation of movement in the same direction.
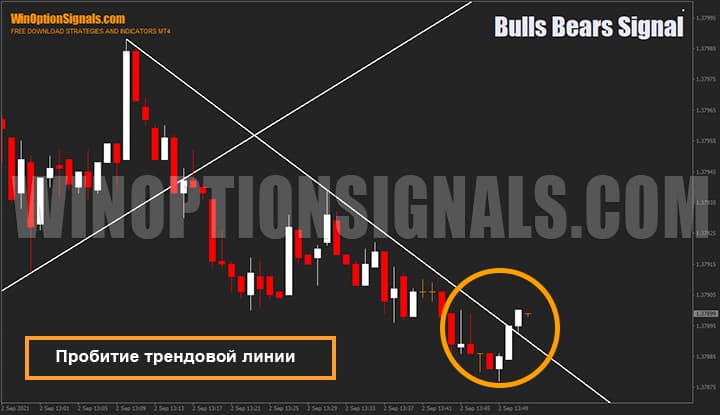
- Breaking the trend line may mean a trend reversal.
Rebound from sloping lines occurs in markets with a pronounced trend movement. The price cannot move constantly in one direction and when it encounters strong resistance it rolls back in the opposite direction. Trend retracements are the best place to enter the market if you are late in the move.
Operating rules:
- If during a bullish trend the price pulls back and approaches the sloping line, this opportunity can be used to buy a Call option;
- When the price approaches the sloping line in a bearish trend, it is time to buy a Put option.
Breaking the sloping line can mean a trend reversal and opens up opportunities for concluding a deal:
- When breaking from bottom to top – buy a Call option;
- If it breaks from top to bottom, buy a Put option.
Beware of large impulse candles that break the line. In this case, it is better to ignore the signal. An additional filter can be various forms of candles, described in detail in the Japanese candlestick analysis method .
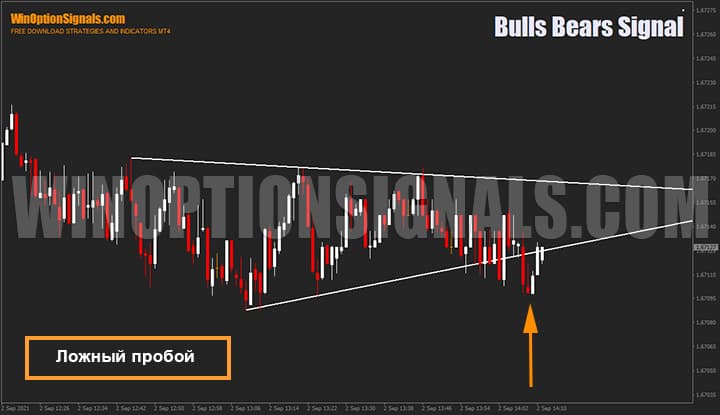
After breaking through the inclined line, it is not always possible to observe a change in trend. This situation in the market is called a “False Breakout” and leads to a trend reversal rather than to its continuation. A false breakout is a very strong signal, after which the price sharply rushes in the opposite direction.
Experienced traders recommend not to rush to enter the market immediately after the first breakout, which most often happens to be “false”. For a more accurate entry, you should wait for the second candle and only then open a trade.
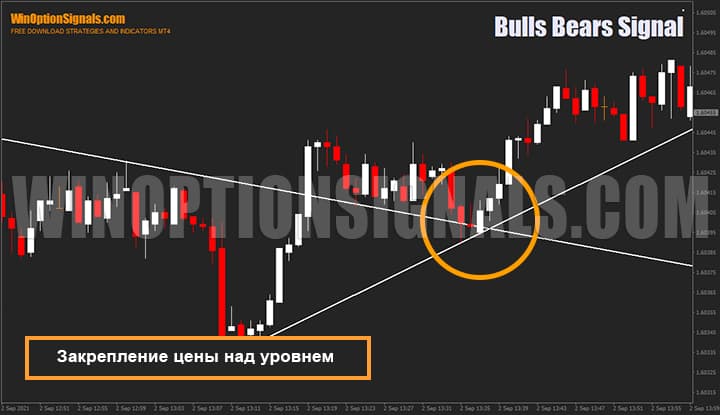
Often in the market you can find price fixing to a level, when the price smoothly moves beyond the inclined line and at the same time the role of the support or resistance line changes. For example, in situations where the price has crossed the inclined line of the inter-foreign trend, bounced off it and rushed in the opposite direction, such a movement can be called “Fixing the price behind the level.”
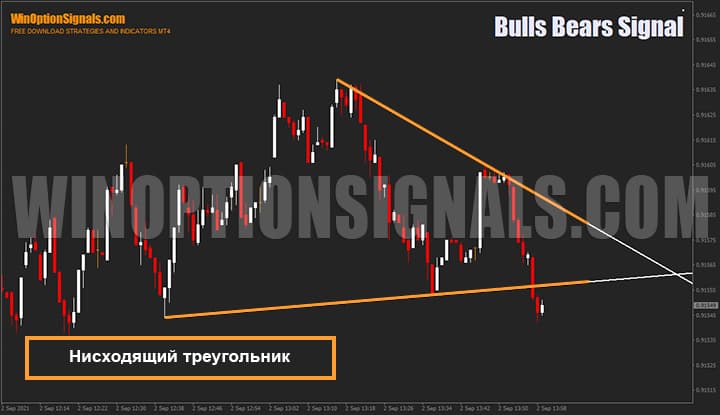
Thanks to the Bulls Bears Signal indicator, it is much easier to see graphical analysis patterns on the chart: symmetrical, ascending and descending triangles.
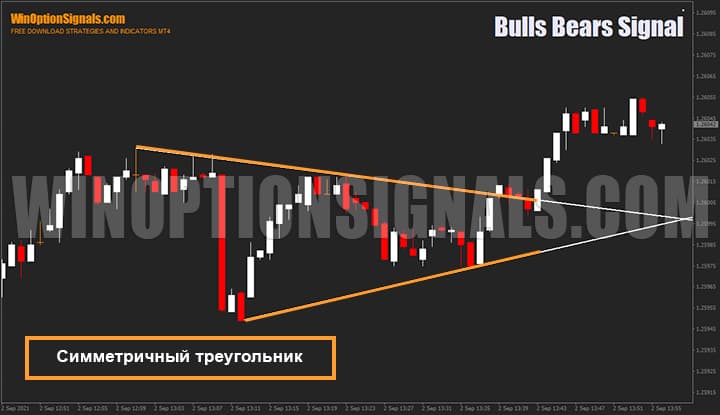
These patterns precede both a reversal and a continuation of a trend:
- Symmetrical triangle – high probability of trend continuation;
- Descending triangle – likely price decline;
- An ascending triangle means a price increase is likely.
Signals and trading using the Bulls Bears Signal indicator
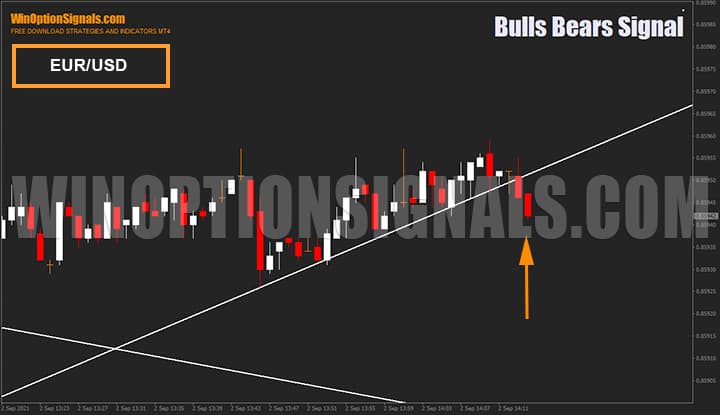
Currency pair EUR/USD: the price was unable to break through strong resistance, and instead, broke through the sloping line from top to bottom. Such a signal can be regarded as an entry point for buying a Put option.
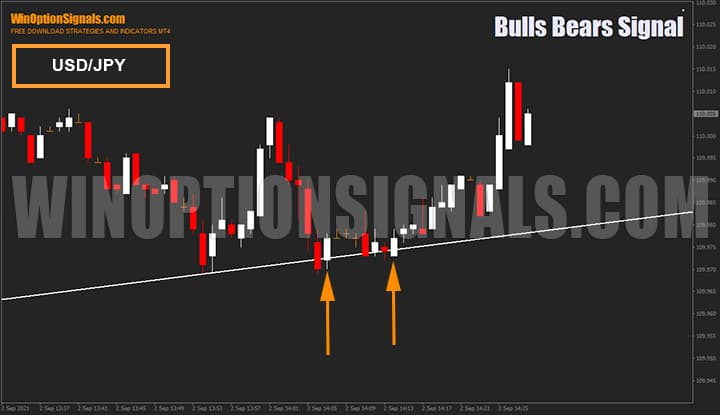
The USD/JPY currency chart shows work with the “rebound” indicator: the price touched the inclined line twice, but failed to break through it downwards. The approach of the price to inclined levels may mean the continuation of the trend, which is what happened in the screenshot below. After the rebound, you need to wait for the second candle, and only then assess the situation on the market.
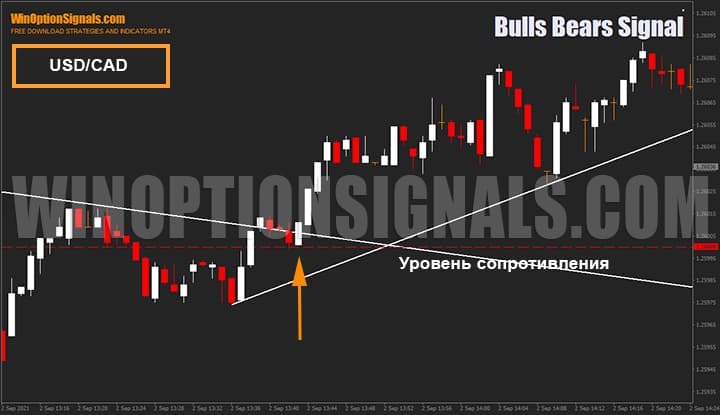
On the chart of the USD/CAD currency pair, in addition to sloping lines, there is also a horizontal resistance level. As we can see in the chart below, the currency pair, simultaneously with breaking through the inclined line, consolidated above the resistance level. This is an example of a strong signal before a price rise and the effective use of several technical analysis tools.
Conclusion
The Bulls Bears Signal indicator is designed to simplify market analysis and trading in general. Automatic construction of inclined levels and alerts built into the terminal can only have a positive impact on the results of both a beginner and a trader with many years of experience in the market.
A trader’s success largely depends on his trading strategy, but the rules of money management and risk management also play an important role, without which long-term “relationships” with the market are impossible. There is only one method of money management: you do not need to use martingale, averaging, or any other sophisticated method to make a profit. It is enough to use a fixed rate of 2-5% of the deposit without doubling.
Before working on a real account, practice your skills on a demo account . This is safe and does not lead to a loss of deposit. Profitable work in the market also depends on the choice of broker . Our website presents a rating of the best binary options brokers , where you can choose trading conditions that are right for you.
Download the Bulls Bears Signal indicator for free
Can't figure out how this strategy or indicator works? Write about it in the comments to this article, and also subscribe to our YouTube channel WinOptionSignals , where we will definitely answer all your questions in the video.
See also:
What novice traders need to know about binary options


To leave a comment, you must register or log in to your account.