 One of the basic positions of technical analysis is the periodic repetition of graphic figures. When developing their own profitable strategy, professionals further examine the chart to identify patterns. Trading using pattern identification has a high success rate.
There are many software products that make it easier for a trader to analyze the current situation. One of them is the custom indicator “FX Forecast”. The principle of its operation is as follows: by studying quotes on history, it finds similar areas and, based on this data, draws its own forecast for several candles ahead. The predicted value is calculated as the arithmetic mean of all similar fluctuations.
How to install the indicator
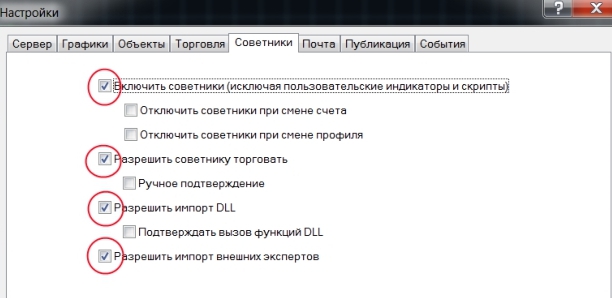
Since FX Forecast is not a standard indicator, it must be installed in the trading platform.
This procedure is simple, any beginner can handle it. Here are the main steps you need to take:
- Download the archive containing the indicator. It consists of a file with the extension mql or ex4. Copy the file to the destination folder MQL4 / Indicators , it is located in the directory where the Metatrader4 terminal is installed. It can be easily found by clicking on “Open data directory” in the terminal menu;
- Restarting the trading platform;
- Open the chart of the asset we want to trade;
- We find custom indicators in the “Insert” menu; “FX Forecast” should appear in their list. When you click on it, a window will pop up asking you to change the standard settings. If necessary, perform the appropriate actions and click “ok”. That's all.
To make the indicator work more correctly, it is recommended to additionally load the quote history of the trading asset being used. To do this, press F2 and select a pair, timeframe.

Instructions for installing indicators in MetaTrader 4:
Features of the “FX Forecast” indicator
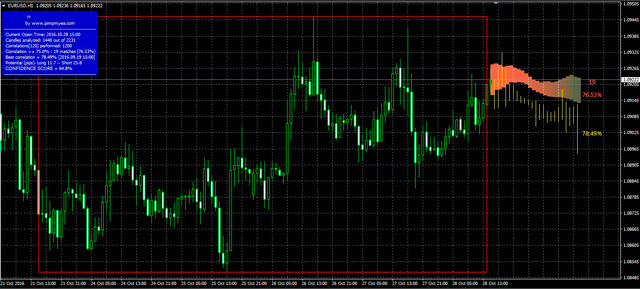
“FX Forecast” consists of two blocks:
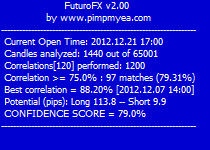
- informational, in which statistical data is presented (upper left corner of the terminal window);
- predictive - displays the probable movement of quotes on the chart in orange.
The program takes several candles as an example (their number is configured in the options) and searches for similar chart segments in history. The similarity of these areas is calculated as a percentage, and those with too low indicators are eliminated - up to 75% (standard settings, they can be changed). By analyzing the candles that follow the matching sections, a forecast of price movement is made. The most exact match found is highlighted in yellow.
No indicator is recommended to be used as an independent trading system; filtering of signals is necessary. If you decide to use “FX Forecast” exclusively, analyze its “predictions” on several timeframes. You should only enter the market if the forecasts match.
Information block
 A customizable data window provides the user with the following useful information:
- when the current candle opened;
- number of candles studied;
- number of comparisons;
- how many similar sections of candles were found with a specified percentage of matches;
- similarity of the best match as a percentage;
- potential for decline or growth in points;
- the percentage of confidence the program has in the final forecast.
Customizable options for the “FX Forecast” indicator
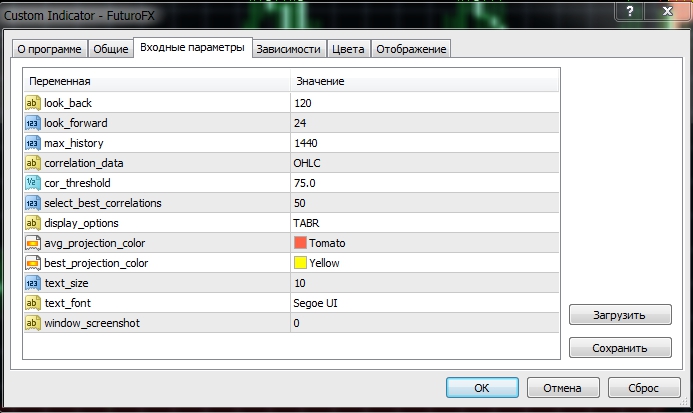
- Look Forward - the number of candles for which a forecast is required.
- Look Back - the number of candles that form a “segment” of the chart to search for similar ones in history.
- Cor Threshold - the user’s preferred percentage of similarity, affects the number of elements found. The higher it is, the less data will be found to make a forecast.
- Correlation Data is a setting for advanced users. Sets filters to search for similar “segments”. The standard is OHLC, which detects matches based on the opening, closing, high and low prices of the candle. The data is added and the arithmetic mean is calculated.
- Display Options controls the visual interface. With its help, some options are disabled:
- T - information block,
- A - average forecast,
- B - best match
- R—selecting the segment of the graph under study using a rectangle.
- Select Best Correlations specifies a parameter such as the number of matches on the basis of which analysis and prediction are made. If it is set to “0”, then all detected by the program are taken into account.
- Best Projection Color - select the color of the line that highlights the most exact match on the graph.
- Avg Projection Color - determines the color of the thick line showing the direction of the probable movement of quotes.
- Text Font and Text Size allow you to select the font and size of the text.
- Window Screenshot includes such a useful feature as automatic saving of screenshots, they can be found in the experts/files folder. If the value is 1, for example, snapshots will be taken when each new candle is formed. The number "0" disables the option.

Download the indicator "FX Forecast"
Can't figure out how this strategy or indicator works? Write about it in the comments to this article, and also subscribe to our YouTube channel WinOptionSignals , where we will definitely answer all your questions in the video.
See also:


To leave a comment, you must register or log in to your account.