In which direction the trend will turn can be determined thanks to the reversal graphic pattern 123. Pattern 123 is a graphical model, having correctly identified it, you can certainly predict a change in the direction of movement of the price of a trading instrument from an upward to a downward trend and vice versa. Thanks to the 123 pattern, we can answer the question that traders ask: is this a reversal or just a short-term change? This review will introduce you to the characteristics of pattern 123, nuances, indicators and means of identifying it on a chart.
Instructions for installing indicators in MetaTrader 4 :
Graphical pattern definition
Each asset and timeframe contains pattern 123, and a special indicator, pattern 123, can help you find it on the chart (the download link can be found after the article).
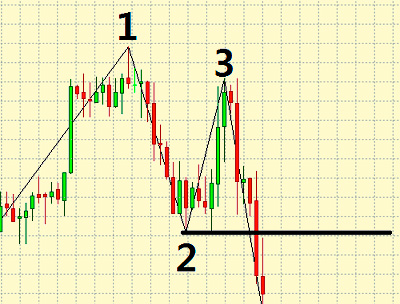
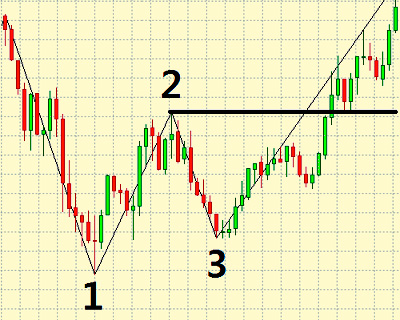
Pattern 123 can be identified by three reversals. The reversals come one after another. They are formed at the end point of an upward or downward trend.
A trend is a vector that indicates the direction of market dynamics. There are three types of trend: upward, downward and horizontal.
Characteristics (uptrend):
Directed movement towards a consistent increase characterizes an upward trend. The new high in a given trend will always be higher than each new low.
- at the top of an uptrend you can encounter the first reversal, followed by a short downward movement of the chart;
- the second reversal forms a new low. Next comes price growth;
- The third reversal can be detected where the chart moves down below the minimum (the appearance of the minimum is ensured by reversal number two).

Characteristics (downward trend):
A curve that moves in a consistent downward direction characterizes a downward trend.
- a reversal that occurs at the lower top of a downtrend and represents the beginning of a short-term upward movement is called the first reversal;
- the formation of a maximum and subsequent decrease in value - reversal point number two;
- moving the chart beyond the second reversal line up to the maximum line and further (third reversal).

Features on the market
Only if, upon completion of turn three, the price breaks the level of the second reversal, Pattern 123 will be realized. But if such a situation is not observed on the chart, we can conclude that the time has not come when there will be enough strength in the market to break the previous trend.
The extent of Pattern 123 is not necessarily exactly the same as in the pictures shown earlier. The length can be about several dozen candles.
The following requirement must be observed: reversal number three is always located below the level of the first reversal in an uptrend, and above it in a downtrend.
A good place to form the 123 pattern is when reversal number one comes from a candle with a long shadow, preferably if the candle is a Pin Bar. It is believed that the more candles the Pattern consists of, the stronger the upcoming movement will be.
You must also remember about leading indicators - oscillators (Stochastick, RSI, CCI), which will help you get an additional signal for entry.
Indicator

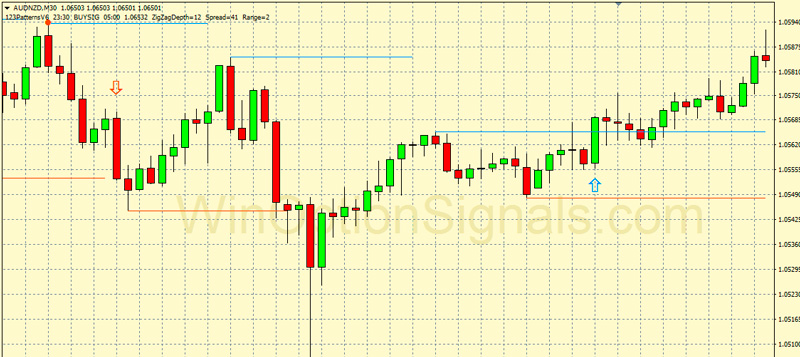
The Pattern 123 indicator is needed in order to quickly establish the probable variants of the pattern on the chart.
You will need points that will mark the beginning of the reversal count. But you should not completely rely on the indicator, because it is not always reliable, like other similar models.
Most likely, you will have to check good signals for buying binary options yourself, according to the conditions described above. The indicator can help to visually display the pattern model on the chart, as well as suggest hidden graphic patterns of the 123 pattern.
Download the Pattern 123 indicator for free:
Can't figure out how this strategy or indicator works? Write about it in the comments to this article, and also subscribe to our YouTube channel WinOptionSignals , where we will definitely answer all your questions in the video.


To leave a comment, you must register or log in to your account.